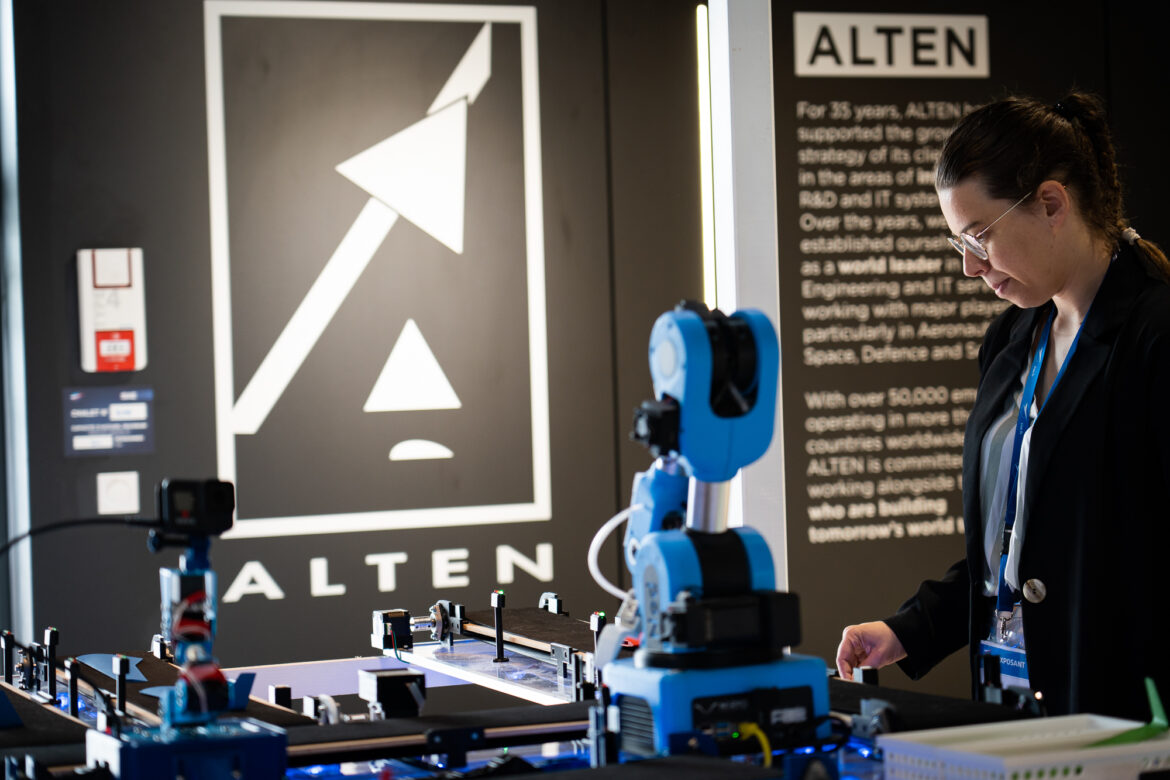
Dai Wenyuan, Test Engineer at ALTEN China, specializes in testing and validation for intelligent driving perception systems. With new model versions released almost every week, he has become increasingly convinced that testing should not simply be the final checkpoint. Its real value lies in building a robust line of defense throughout the entire development process, from data and simulation to real-world vehicle testing, so that “phantom braking” can be identified and addressed before it reaches the road.
What is phantom braking?
Dai Wenyuan encountered precisely this during a routine urban expressway test. The test vehicle suddenly executed an emergency brake. Data replay revealed that a Bird"s Eye View (BEV) perception network had interpreted the horizontal groove pattern on a noise-barrier wall as the bodywork crease of a stationary lorry.
The incident was not isolated. Four similar phantom-braking events occurred within a single month. Confronted with this pattern of static-obstacle false positives, the conventional "detect, fix and retest" reactive loop had hit its ceiling. Validation, Dai argues, must cease to be a goalkeeper stationed at the end of the production line and become the architect of a systemic defence.
Root Cause: A Triple Failure
Statistical analysis of phantom-braking incidents over the preceding three years reveals that nearly 70% stem from static-object misdetection, with walls, guardrails and construction hoardings accounting for 80% of those cases. The failure mechanism cascades through three layers:
01 Sensor-Level Feature Aliasing
In side-backlight conditions, horizontal wall grooves generate high-contrast chiaroscuro textures. Millimetre-wave radar lacks the angular resolution to distinguish the point-cloud signature of a flat wall from that of a vehicle flank. The multi-sensor fusion pipeline seeds the error at the feature-extraction stage.
02 Algorithmic Statistical Shortcuts
In the training data, the feature combination of "horizontal crease + rectangular outline + stationary state" correlates with lorry targets in 90% of instances. The BEV network learns this spurious correlation as a heuristic shortcut, never developing negative-sample awareness of "creased concrete walls".
03 Validation Blind Spots
The enclosed proving ground offered only three standard wall-test scenarios, all conducted in flat midday light. The regime systematically failed to cover side-backlight, low-angle sun, post-rain reflections, or weathered, peeling textures. Validation remained a discrete spot-check rather than a continuous shield.
Solution: A Four-Tier Defence Architecture
Drawing on this origin analysis, the team established a four-tier defence system. Tiers one to three are capability layers, building test competence across data, simulation and real-world vehicle domains. Tier four is a governance layer that hardens the first three into mandatory nodes of the delivery pipeline.
01 Tier One: Adversarial Dataset
Mining millions of kilometres of fleet data, the team isolated clips in which static objects were misclassified as dynamic targets. From these they constructed boundary scenarios: varying solar elevation, rain and fog, soiled camera lenses, walls plastered with diagonal stickers. The resulting 100,000-frame adversarial dataset serves as a mandatory stress-test entry point for every model release. Only those with a false-detection rate below the threshold graduate to simulation validation.
02 Tier Two: Simulation Replay
Using Neural Radiance Field (NeRF) technology, the team reconstructs real-world road scenes in three dimensions, preserving the microscopic features that trigger error: groove depth, peeling reflective paint, rain-stain distribution. An adjustable lighting system replicates the exact environmental parameters of the incident day.
For the first time, a real defect was reproduced without using a physical vehicle. Algorithm teams can adjust feature-extraction weights, optimise fusion thresholds and augment negative samples within the digital twin, then replay the identical scene in a single click to verify the fix. Validation cycles collapsed from days in a real car to hours in simulation.
03 Tier Three: Shadow Mode
Test and production vehicles use a dual-model parallel architecture: the production model executes actual control, while the test model performs shadow inference in the background, with outputs compared in real time. When the test model flags a "wall misclassified as lorry" that the production model ignores, the system automatically logs raw sensor data, GPS position and ambient lighting to the data centre.
Within months, thousands of perception-divergence events were captured, blocking several at-risk model versions from entering the OTA update queue. In one case, a new model misclassified an overhead-gantry shadow as a stationary lorry; shadow mode intercepted it during simulation validation.
04 Five-Stage Quality Gate: Hardening Capability into Process
Capability is worthless without process discipline. The five-stage quality gate embeds each test layer into the delivery pipeline as a non-negotiable checkpoint:
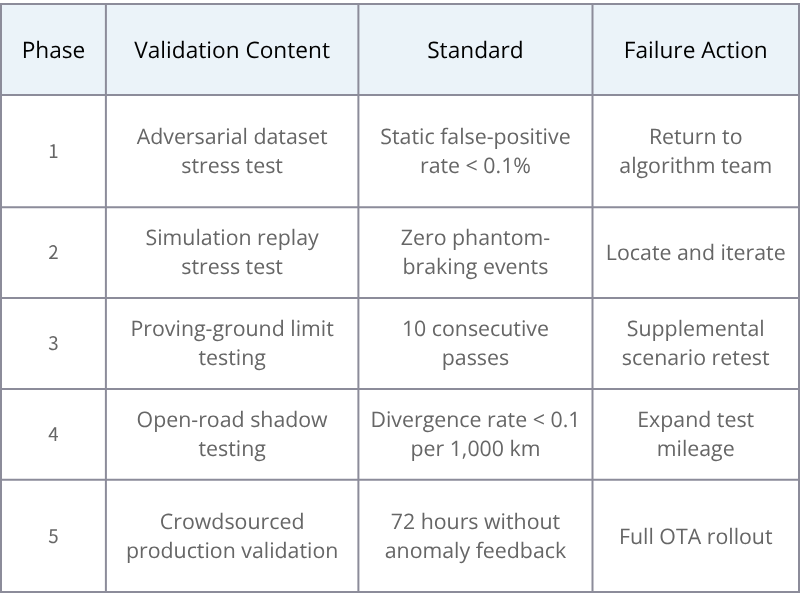
Stages one to three validate the capability layers; stages four and five provide progressive validation for shadow mode and production release.
Results: From Passive Interception to Active Defence
Two months after the overhaul, the metrics shifted dramatically:
The deeper transformation was cultural.
Algorithm engineers began actively considering boundary-scenario coverage during model design, rather than treating validation as an external audit after delivery.
Test engineers moved from executing test cases and logging bugs to designing defence mechanisms, defining entry criteria and monitoring production data.
At the organisational level, the five-stage principle became a shared language across teams.
Algorithm, test, data and simulation groups converged on a common understanding of delivery standards; disputes shifted from "whether to release" to "how to meet the standard". Transparent processes and explicit rules cut communication costs and accelerated decision-making.
Three Pitfalls and Corrections
01 The "Over-Beautification" of Simulation
Early NeRF reconstructions produced wall surfaces that were implausibly smooth and clean, inflating simulation pass rates while the same defects reappeared in physical vehicles.
Correction: mandate retention of centimetre-scale surface roughness, authentic stain distribution and hairline cracks. The goal of simulation is not visual realism but the precise reproduction of the physical conditions that induce error.
02 Data Noise Drowning Shadow Mode
During the first week, returned data volumes surged. Normal model divergences drowned safety-critical anomalies.
Correction: introduce a divergence-grading mechanism. Only safety-relevant misclassifications trigger full data return. The signal-to-noise ratio improved markedly.
03 Dogmatic Enforcement of Quality Gates
One model failed the proving-ground test because a sudden downpour fogged the camera lens. Under the rules, it should have been rejected, but the algorithm team argued this was an environmental anomaly.
Correction: maintain strict rule enforcement, but add an "environmental anomaly annotation" clause. When test conditions exceed the design envelope, teams may annotate and request supplemental testing rather than facing a binary pass-or-fail.
Conclusion
Perception models carry inherent limitations in the open world. The value of validation lies not in proving the model perfect, but in identifying and eliminating defects before they reach the user. Technical debt does not dissolve on its own. Yet every systematic, proactive repayment raises the reliability boundary of perception delivery.






 CN
CN